1.7.5.4. Fishing mortality
In Osmose, there are two implementations of the fishing mortality:
One in which fishing mortality is by-species. It is the implementation that has bee used so far. In this implementation, bycatch, discards and size-selectivities are not taken into account.
One in which fishing mortality is by-gear. In this case, bycatch and discards can be taken into account through a catchability matrix. Additionnally,size-selectivity can be explicitely considered.
1.7.5.4.1. By-species fishing mortality
On Osmose versions previous to 4.0.0, fishing mortality was species-specific. It was parameterized either by providing fishing rates or catches.
mortality.fishing.type |
Whether fishing mortality is provided as |
mortality.fishing.recruitment.age.sp# |
Age at which a species can be fished (years) |
mortality.fishing.recruitment.size.sp# |
Size at which a species can be fished (cm) |
Warning
Osmose does not accept fishing mortality rates for some species and catches for other species.
1.7.5.4.1.1. By rate
If mortality rate is provided, the number of dead fishes in a school is computed as follows.
Osmose offers several degrees of refinement for inputting the fishing mortality: constant, seasonal, interannual and interannual with age or size class. Depending on the available information for each species of the configuration, one must choose the best way to input it. Each species can be parameterized independently from an other. For instance fishing mortality for species zero is a constant annual rate and fishing mortality for species three is provided as a time series per size class.
mortality.fishing.rate.byDt.byAge.file.sp# |
CSV file containing the fishing rates by age and by time-step |
mortality.fishing.rate.byDt.bySize.file.sp# |
CSV file containing the fishing rates by size and by time-step |
mortality.fishing.rate.byYear.file.sp# |
File containing the fishing rates by year |
mortality.fishing.rate.sp# |
Annual fishing rate |
mortality.fishing.season.distrib.file.sp# |
File containing the seasonal distribution of fishing mortality. If not provided, assumes constant fishing rate |
Osmose will first look for any of the first two parameters. If not found, it will look for the third one. If not found, Osmose will finally look for the fourth one. If the third or fourth parameter are found, it will also looks for the fifth one.
1.7.5.4.1.2. By catches
If mortality is provided by catches, the number dead individuals is computed as follows:
with \(C\) the catches, \(B_{fish}\) the fish biomass, \(W\) its weight and \(B_{fishable}\) the biomass that can be fished.
mortality.fishing.catches.byDt.byAge.file.sp# |
CSV file containing the fishing rates by age and by time-step |
mortality.fishing.catches.byDt.bySize.file.sp# |
CSV file containing the fishing rates by size and by time-step |
mortality.fishing.catches.byYear.file.sp# |
File containing the fishing rates by year |
mortality.fishing.catches.sp# |
Annual fishing rate |
mortality.fishing.season.distrib.file.sp# |
File containing the seasonal distribution of fishing mortality |
Note
Catches are assumed to be in tons.
Osmose will first look for any of the first two parameters. If not found, it will look for the third one. If not found, Osmose will finally look for the fourth one. If the third or fourth parameter are found, it will also looks for the fifth one.
1.7.5.4.1.3. Marine Protected Areas (MPAs)
The user can defined as many MPA as he wishes.
mpa.file.mpa# |
File containing the MPA definition |
mpa.start.year.mpa# |
First year when this MPA is active |
mpa.end.year.mpa# |
Last year when this MPA is active |
The map is a CSV file similar to the movement maps. The CSV file has the same number of lines and columns as the OSMOSE grid. The MPA file must contain 1 where the MPA is defined, 0 elsewhere.
Start year and end year parameters define the time span when the MPA is enabled.
The MPA are handled within the fishing process. Every time there is a new MPA to be activated or deactivated, Osmose updates the correction factor that will be applied to the fishing mortality rates in order to take into account the uniform redistribution of the fishing effort outside the MPAs.
1.7.5.4.2. By-gear fishing mortality
1.7.5.4.2.1. Fishing mortality rates
In the Osmose versions >= 4.3, changes in the parameterization of fisheries have been implemented, although the spirit remains close to the one in versions 4.
Fisheries mortality time-series for each gear are now the product of three components:
A vector of fishing mortality rates associated with fishing periods, \(F_{period}\)
A vector of seasonality values, which provides the time-variation of the fishing effort during a given season, \(F_{season}\)
A vector of multipliers, which provides a multiplication factor, \(F_{base}\).
Therefore, for a given time-step \(t\), the value of the fishing mortality for a given fleet would be:
Since the parameterisation is a bit tricky, a parameter (fisheries.check.enabled) allows to control whether the values of \(F\),
\(F_{period}\), \(F_season\) and : math:F_base should be saved. It allows to control that the given time-series are as expcted.
1.7.5.4.2.1.1. Fishing base
The fishing base mortality multiplier (\(F_{base}\)) is provided as regime shifts.
fisheries.rate.base.fsh# |
Fishing base for the different regimes. |
fisheries.rate.base.shift.fsh# |
Years of the regime shifts. |
fisheries.rate.base.log.enabled.fsh# |
True if fisheries are provided in logscale. |
If one value is provided in fisheries.rate.base.fsh#, this value will be used during all the simulation.
If \(N\) values are provided, then the fisheries.rate.base.shift.fsh# parameter must contain \(N-1\) values, which are the years of the regime shifts.
1.7.5.4.2.1.2. Fishing period
There is now the possibility to define a fishing period (\(F_{period}\)), i.e. a period when the fishery is active.
fisheries.period.number.fsh# |
Number of fishing periods within one year (\(N_{per}\)) |
fisheries.period.start.fsh# |
Start of the active fishing period (fraction of year, default = 0, \(Y_{start}\)) |
fisheries.rate.byperiod.fsh# |
Fishing mortality rate. Must me in \(year^{-1}\) |
Note that the number of values expected in the fisheries.rate.byperiod.fsh# parameter depends on \(Y_{start}\).
If \(Y_{start} = 0\), then \(N_{per} \times N_{year}\) values are expected (one value for each fishing and non-fishing season).
If \(Y_{start} \neq 0\), then \(N_{per} \times N_{year} + 1\) values are expected.

Fig. 1.8 Fishing period for two values of \(Y_{start}\)
1.7.5.4.2.1.3. Fishing seasonality
In order to distribute the fishery mortality over the season, the user can define a seasonality vector, either as a file, or as a vector.
fisheries.seasonality.fsh# |
Array of fishing seasonality. Must contain \(\frac{N_{step/year}}{N_{season}}\) |
fisheries.seasonality.file.fsh# |
File containing the fishing seasonalities (must contain \(N_{step}\) values) |
In the first case, the same seasonality will be applied for each fishing season. Imagine that we have 24 time-steps per year and two fishing season (with no offeset, top of figure Fig. 1.8), then the seasonality provided should contain 12 values, which would apply for the active fishing period (green zone).
In the latter case, it is up to the user to generate the proper time series and to store it in a file.
Danger
The sum of fishing seasonalities must equal one over the fishing seasons! No automatic normalisation is performed by Osmose!
1.7.5.4.2.1.4. Case studies
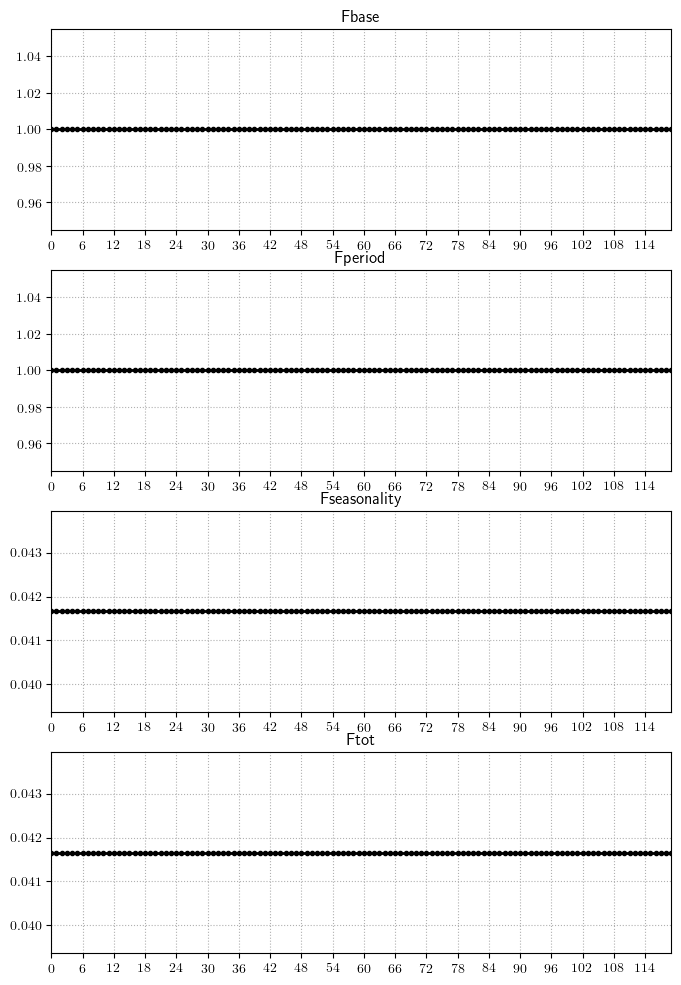
fisheries.rate.base.fsh0;1
fisheries.season.number.fsh0;1
fisheries.rate.byperiod.fsh0;1
fisheries.season.start.fsh0;0
fisheries.seasonality.fsh0;0.04166;0.04166;0.04166;0.04166;0.04166;0.04166;0.04166;0.04166;0.04166;0.04166;0.04166;0.04166;0.04166;0.04166;0.04166;0.04166;0.04166;0.04166;0.04166;0.04166;0.04166;0.04166;0.04166;0.04166;0.04166;0.04166;0.04166;0.04166
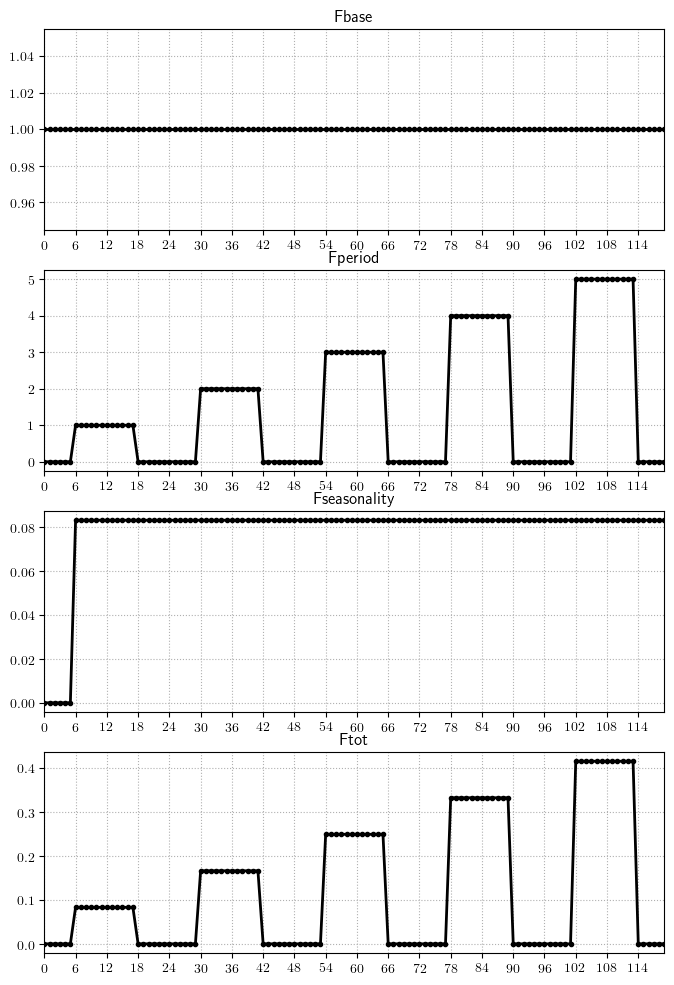
fisheries.rate.base.fsh0;1
fisheries.season.number.fsh0;2
fisheries.rate.byperiod.fsh0;1, 0, 2, 0, 3, 0, 4, 0, 5, 0
fisheries.season.start.fsh0;0
fisheries.seasonality.fsh0;0.0;0.0;0.0;0.0;0.0;0.0;0.1666;0.1666;0.1666;0.1666;0.1666;0.1666;

fisheries.rate.base.fsh0;1
fisheries.season.number.fsh0;2
fisheries.rate.byperiod.fsh0;0, 1, 0, 2, 0, 3, 0, 4, 0, 5, 0
fisheries.season.start.fsh0;0.25
fisheries.seasonality.fsh0;0.0833;0.0833;0.0833;0.0833;0.0833;0.0833;0.0833;0.0833;0.0833;0.0833;0.0833;0.0833;
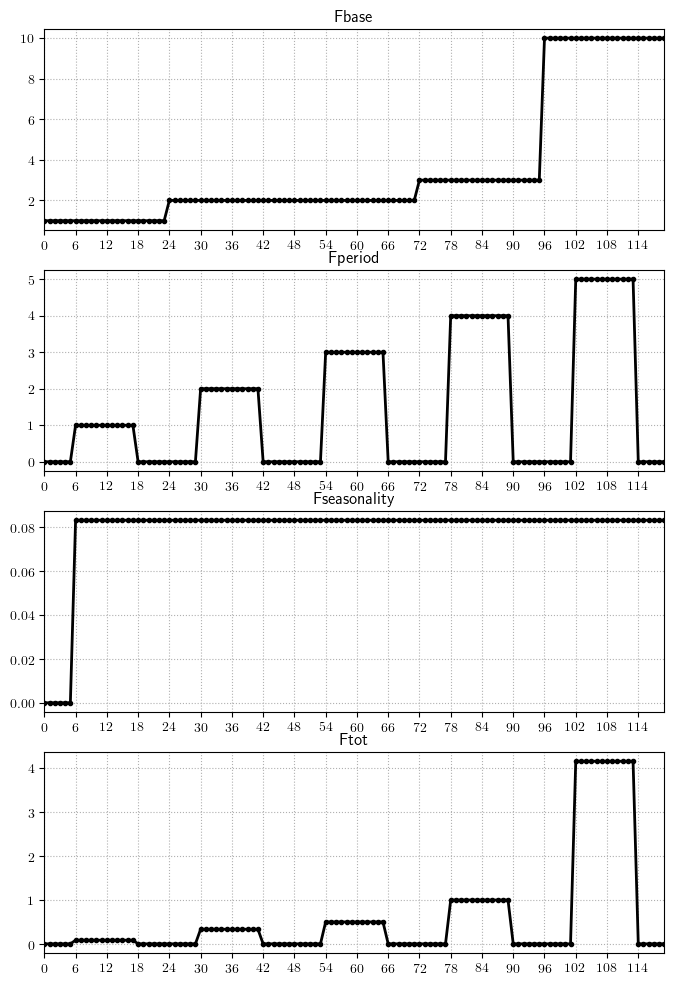
fisheries.rate.base.fsh0;1,2,3,10
fisheries.rate.base.shift.fsh0;1, 3, 4
fisheries.season.number.fsh0;2
fisheries.rate.byperiod.fsh0;0, 1, 0, 2, 0, 3, 0, 4, 0, 5, 0
fisheries.season.start.fsh0;0.25
fisheries.seasonality.fsh0;0.0833;0.0833;0.0833;0.0833;0.0833;0.0833;0.0833;0.0833;0.0833;0.0833;0.0833;0.0833;
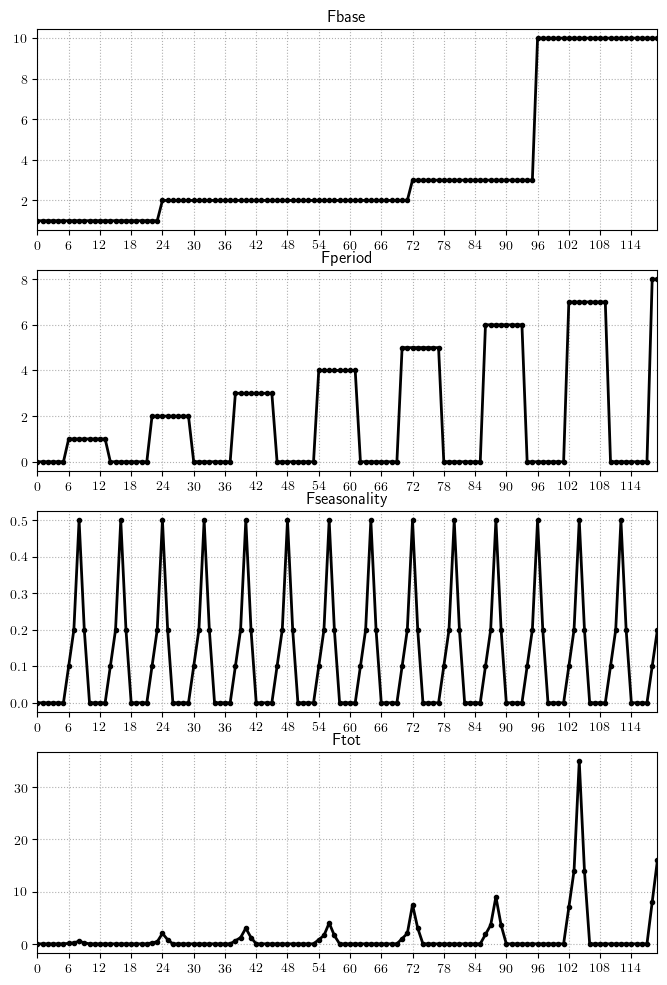
fisheries.rate.base.fsh0;1,2,3,10
fisheries.rate.base.shift.fsh0;1, 3, 4
fisheries.season.number.fsh0;3
fisheries.rate.byperiod.fsh0;0, 1, 0, 2, 0, 3, 0, 4, 0, 5, 0, 6, 0, 7, 0, 8
fisheries.season.start.fsh0;0.25
fisheries.seasonality.fsh0;0.1,0.2,0.5,0.2,0,0,0,0
1.7.5.4.2.2. Size selectivities
fisheries.selectivity.tiny.fsh# |
Selectivities values below which selectivity if forced to 0 (\(\epsilon\)) |
fisheries.selectivity.type.file.fsh# |
File containing the selectivity types |
fisheries.selectivity.type.shift.fsh# |
Array containing the selectivity periods |
fisheries.selectivity.type.fsh# |
Selectivity types (one value per shift period). Must be 0, 1 or 2 |
fisheries.selectivity.a50.file.fsh# |
File containing the age selectivities. |
fisheries.selectivity.a50.shift.fsh# |
Array containing the \(A_{50}\) shift periods |
fisheries.selectivity.a50.fsh# |
Age selectity (one value per shift period). If set, assumes that fishery selectivity is age-based |
fisheries.selectivity.l50.file.fsh# |
File containing the \(L_{50}\). |
fisheries.selectivity.l50.shift.fsh# |
Array containing the \(L_{50}\) shift periods |
fisheries.selectivity.l50.fsh# |
\(L_{50}\) (one value per shift period). |
fisheries.selectivity.l75.file.fsh# |
File containing the \(L_{75}\) |
fisheries.selectivity.l75.shift.fsh# |
Array containing the \(L_{75}\) shift periods |
fisheries.selectivity.l75.fsh# |
\(L_{75}\) (one value per shift period). |
Note that type, a50, l50 and l75 are parameterized in the same way.
If the .file parameter is defined, then it is used. If it is not set, then values are defined by using the other two parameters.
The shift array contains thresholds, where the values are to change.
The selectivity type must contain 0 (knife-edge), 1 (sigmoid), 2 (Gaussian) or 3 (log-normal).
If one of the a50 parameter, it is assumed that age selectivity is used.
Warning
Only knife-edge selectivity can be used with age.
Note
If only knife-edge selectivity is used, then
the l75 parameters are not used.
1.7.5.4.2.2.1. Knife-edge selectivity
Knife-edge selectivity is computed as follows:
1.7.5.4.2.2.2. Sigmoid selectivity
Sigmoid selectivity is computed as follows:
1.7.5.4.2.2.3. Gaussian selectivity
Gaussian selectivity is computed as follows:
with \(q_{75}\) is the inverse cumulative standard normal distribution for the 75th percentile.
1.7.5.4.2.3. Catchability
Fishery cathabilities are parameterized in a similar way as predation accessibility matrix.
fisheries.catchability.file |
Name of the catchability file |
fisheries.catchability.file.cat# |
Name of the catchability file |
fisheries.catchability.years.cat# |
List of years when the catchability should be used. |
fisheries.catchability.initialYear.cat# |
First year when the catchability matrix should be used (if year list not provided) |
fisheries.catchability.finalYear.cat# |
Last year when the catchability matrix should be used (if year list not provided) |
fisheries.catchability.steps.cat# |
List of steps within a year when the catchability should be used. |
Fishery catchabilities should be provided as a CSV file, with fisheries as column (predators) and species (background and focal) as rows (preys). If
the first parameter (fisheries.catchability.file) is found, then this catchability matrix will be used over the entire simulation.
If this parameter is not found, Osmose will assume that catchability matrixes may vary over time. It will therefore look for all the fisheries.catchability.file.cat# parameters. Each catchability matrix should be associated with time-indications, which specifies on which year (interannual variability) and which time-steps (seasonal variabillity) this catchability matrix should be used.
Warning
Note that the # here is not related to the one of fisheries.
1.7.5.4.2.4. Discards
There is also the possibility to define fisheries discards. It is defined in the same way as catchabilies (cf above for a detailed description of the parameters).
fisheries.discards.file |
Name of the catchability file |
fisheries.discards.file.dis# |
Name of the catchability file |
fisheries.discards.initialYear.dis# |
First year when the catchability matrix should be used |
fisheries.discards.finalYear.dis# |
Last year when the catchability matrix should be used |
fisheries.discards.years.dis# |
List of years when the catchability should be used. |
fisheries.discards.steps.dis# |
List of steps within a year when the catchability should be used. |
Fishery discards should be provided as a CSV file, with fisheries as column (predators) and species (background and focal) as rows (preys).
Note
It is possible to mimic the by-species implementation with the by-gear one, by provinding a diagonal catchability matrix and knife-edge selectivities